UX in VR Environment

How can user experience research be different in a VR environment compared to the typical research method? We explored the efficacy of using VR as a UX tool and how it can be different.
My Role
Research lead, Research design and analysis
Team
Hyunseok Bang: prototyping, Hyojin Lee: research, Jiah Ahn: research, Minju Kim: administration and research
Location
Seoul, Korea
Time
3 months-ongoing
Research Structure
-
-
-
It all begins with an idea. Maybe you want to launch a business. Maybe you want to turn a hobby into something more. Or maybe you have a creative project to share with the world. Whatever it is, the way you tell your story online can make all the difference.
-
It all begins with an idea. Maybe you want to launch a business. Maybe you want to turn a hobby into something more. Or maybe you have a creative project to share with the world. Whatever it is, the way you tell your story online can make all the difference.
Exploring User Experience (UX) Research
in Virtual Reality (VR)
-
Observe the differences between traditional UX and UX in VR.
Research Goal 1
-
Explore the quality of answers during interviews after VR experiments.
Research Goal 2
-
Analyze the researchers' insights in conducting UX in VR.
Research Goal 3
Background
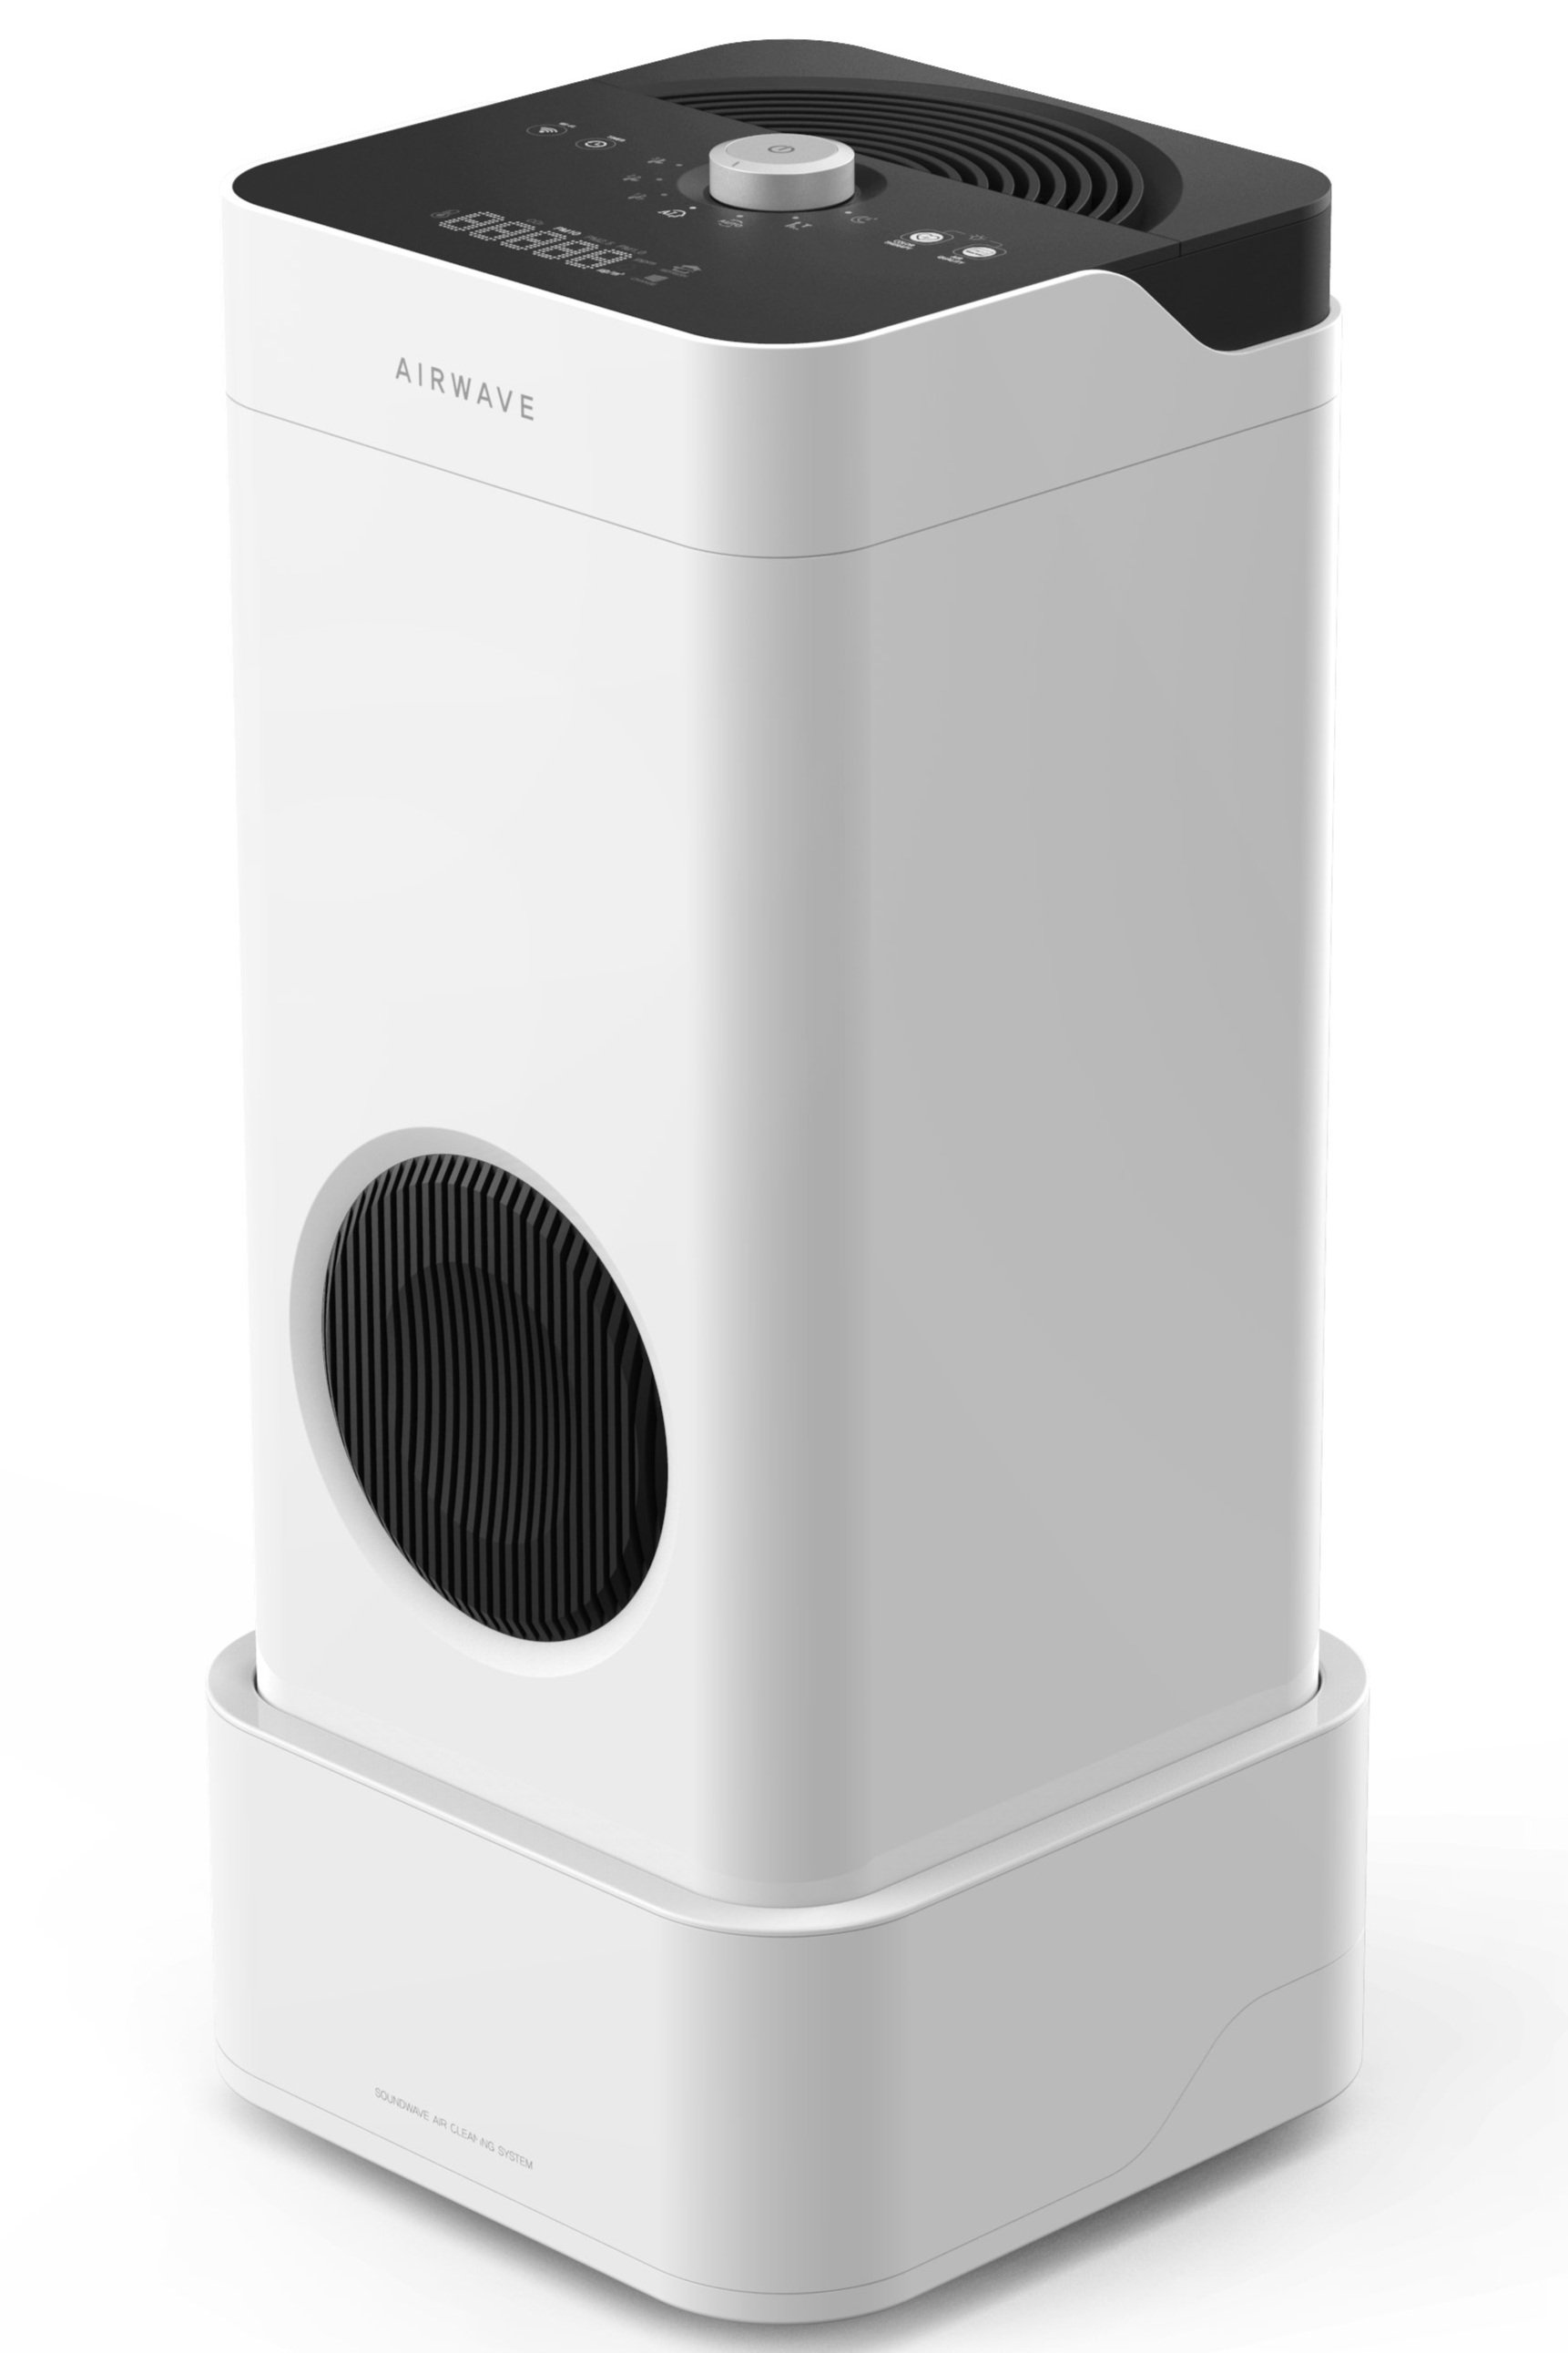
The research stemmed from a project to build and test the ‘smart air purifier’; the team had the responsibility to discover the most preferred feedback method as well as the most preferred level of automation of the purifier.
Questionnaire Design
-
Asking for the respondent’s self-assessed level of confidence.
I can express my thought well.
I can explain what I think well.
I talk logically.
I can answer according to the context of the topic.
I understand the interviewer’s context very well.
I would not repeat the responses I made.
I have the confidence to my response.
I felt easy to answer the questions.
-
Five 5-Point Likert Scales each for the preference of feedback method and preference of automation level
-
Reference: Stewart, R. A., Hauge, L. S., Stewart, R. D., Rosen, R. L., Charnot-Katsikas, A., & Prinz, R. A. (2007). A CRASH course in procedural skills improves medical students’ self-assessment of proficiency, confidence, and anxiety. The American journal of surgery, 193(6), 771-773.
Quantitative Study
Qualitative Study
-
Functionality, Pleasure
-
Usability, Quality, Practicality, Complexity, Utterance, Confidence
-
Relevance to design and marketing, relevance to research and education on UX, Resources, Clarity, Objectivity
-
Law, Effie Lai-Chong, Paul Van Schaik, and Virpi Roto. "Attitudes towards user experience (UX) measurement." International Journal of Human-Computer Studies 72.6 (2014): 526-541.
Study Design
-
Between-Subjects Experiment
H1: Participants will feel more confident in their responses after the VR testing than after watching a 2D video.
Experimented with 20 participants.
-
Building VR Environment
Using Unity program, we programmed the movement of the air purifier according to each scenario. I designed the environment with allocating the usual objects of a living room.

-
Making 2D Video
Using After effects, I made a collage of a video with the 3D environment made from Unity per each scenario.

Study Method
Time Period
Conducted for a total of 7 days; 2D video was done on the 1st, 2nd, 3rd, 4th day and VR was done on the 5th, 6th and 7th.
Research Process
After the distribution of IRB consent, the participants learned about the product briefly, as well as the questionnaire explanation. They were then asked to fill in questionnaires including the VR dizziness survey and the researchers filled in their diary questionnaires.
Results Analysis
Quantitative Analysis
Paired t-tests for the confidence level, and simple counts and analysis for the preferences.
Qualitative Analysis
Atlas.ti thematic analysis for both participants and researchers qualitative results. Following results were obtained:
Using paired t-test through scipy의 t_test, each of the statistics for 8 questions were -1.07143151, -1.25379913, -1.75057594, -1.83110381, -1.56576272, -1.45296631, -1.78866227, -1.22798066, -1.93738786 and the p-values were 0.29739719, 0.22512317, 0.09614969, 0.08281384, 0.13390772, 0.16255 , 0.08962643, 0.2344501 , 0.06770819.
If p<0.05, there was no statistically significant result found. However the 4th question, “I can answer well to the context of the question” and the 7th question “I have confidence to my response” were p>0.1 (0.08, 0.09)'—meaning there were differences according to the variable (2D and VR).
Reasons to prefer ‘color’ feedback to beep or voice feedbacks
Reasons to prefer automation level 4 to other levels (1,2,3)
Response patterns for participants in each environment
Researcher insights and level of difficulty in each type of experiment